How To Use Google Analytics' API To Share Your Traffic
on Google analytics api, Open source, Php, Javascript
This is a “proof of concept” post on open sourcing your website’s traffic data. A number of enhancements, both visual and performance wise, can be made. This post walks you through getting the data into your hands, so you can do with it what you will (:
Finished Product: Advanced == OR == Basic
Project on GitHub: Click Here
Sharing Your Traffic
One of the most difficult components of working with Google’s APIs is authentication. Thankfully, Google has a number of client libraries that make this easier.
For this guide, we’ll be using:
- Google’s PHP API Client Library
- Google’s Embeded API
We’re doing this for a couple of reasons. First, I eventually want to package this code into a reusable HTML WebComponent. Second, the Javascript API cannot generate it’s own Auth Token; it needs to be passed one from a server side call.
It’s worth noting that we could swap out the PHP portion of the code with any of Google’s other API Client Libraries.
Installing PHP API Client Library
You need a local PHP server for this to work well. If you don’t already, look into setting one up using either:
After installing a local server, make sure you have composer installed:
Next. open up a new command prompt window. Navigate to your product directory and use this command:
composer require google/apiclient:^2.0.0@RC
If you receive an error, you may want to try:
composer require google/apiclient:^2@RC
Or check out the GitHub Repository for Google’s PHP API Client as the install instructions may have changed.
Google Developers Console
This is where you manage permissions and account associations for all of Google’s APIs. We need to navigate to the Developer Console and create a reference to the project that will be pulling our analytics data.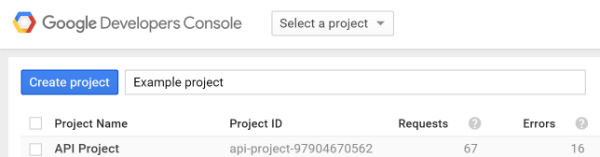
Next, we need to turn on API Access to Google Analytics for this project. From your new project’s dashboard, navigate to “API”, then “Analytics”. You should see this screen. Click “Enable” to turn on support for the Analytic’s API.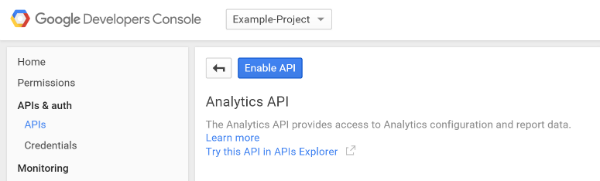
Service Accounts
Okay, now Google requires an authenticated account to access account specific data. We don’t want our users to have to authenticate (they couldn’t see our data anyway). To get around this, Google uses Service Accounts.
Think of our Service Account as just another user account. We need to:
- Create it ;) (It has it’s own e-mail address)
- Grant it account permissions in Google Analytics
- Use it’s credentials to authenticate before requesting data
Create A Service Account
To create a service account, we head back to the Google Developer Console, and access the project we created in our previous steps. You select “Credentials”, “Add Credentials”, and then “Service Account”. You should see your newly created service account as pictured below! Make sure to save the e-mail address of your new account in a text file. We’ll be using it in the next steps.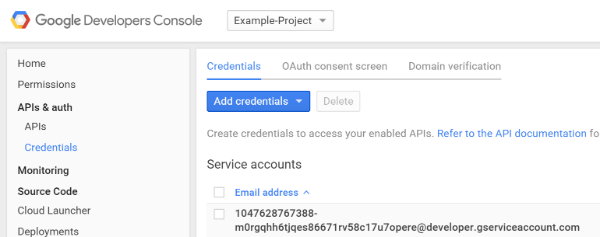
Note: In the last step, you should have been forced to download a JSON Key file. If you don’t have one, or you’ve lost yours, you can generate a new file by viewing the details of your service account and clicking “Generate New JSON Key”
Give Our Service Account Permissions
Next, we need to make sure our Service Account has permission to read the data we want to query. We can give it permission by logging in to our Google Analytics account, navigating to “Admin”, under “Account” selecting “User Management”, and finally by adding “Read & Analyze” permissions for our Service Account using its e-mail address.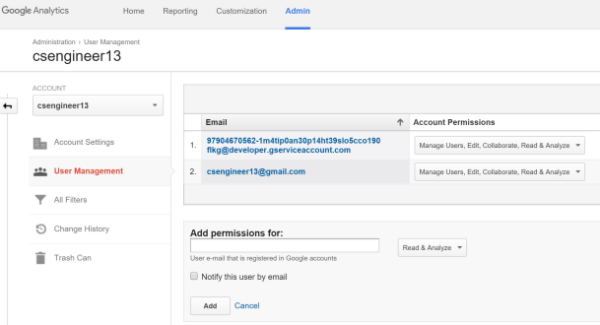
Querying Data
And finally… Lets write some code. Here is the general run-down of what we need to do:
- Use server-side library to authenticate our service account
- Authentication process provides us an access token
- Pass access token to client-side api
- Query for data using embedded client-side api
- Render charts using built in functions
Server-Side Code
<?php
// MUST be using composer
require_once '/path/to/vendor/autoload.php';
session_start();

$client = new Google_Client();
// Name of proj in GoogleDeveloperConsole
$client->setApplicationName("Example Project");

// Generated in GoogleDeveloperConsole --> Credentials --> Service Accounts
$client->setAuthConfig('/some/secure/path/example-project-c0a14bc34a03.json');
$client->addScope(Google_Service_Analytics::ANALYTICS_READONLY);

// Grab token if it's set
if (isset($_SESSION['service_token'])) {
 	$client->setAccessToken($_SESSION['service_token']);
}

// Refresh if expired
if ($client->isAccessTokenExpired()) {
	$client->refreshTokenWithAssertion();
}

// Pin to Session
$_SESSION['service_token'] = $client->getAccessToken();

$myToken = $client->getAccessToken();
?>
Note:
- The
require_onceis referencing a file generated by Composer. setApplicationName()is being passed the name of our projectsetAuthConfig()is passed the location of our JSON Key file- Please put this in a secure place
Client-Side Code
<body>
<!-- Load Google's Embed API Library -->
<script>
(function(w,d,s,g,js,fs){
g=w.gapi||(w.gapi={});g.analytics={q:[],ready:function(f){this.q.push(f);}};
js=d.createElement(s);fs=d.getElementsByTagName(s)[0];
js.src='https://apis.google.com/js/platform.js';
fs.parentNode.insertBefore(js,fs);js.onload=function(){g.load('analytics');};
}(window,document,'script'));
</script>
<div id="chart-1-container"></div>
<script>
gapi.analytics.ready(function() {
/**
* Authorize the user with an access token obtained server side.
*/
gapi.analytics.auth.authorize({
'serverAuth': {
'access_token': '<?php print_r($myToken["access_token"]); ?>'
}
});
/**
* Creates a new DataChart instance showing sessions over the past 30 days.
* It will be rendered inside an element with the id "chart-1-container".
*/
var dataChart1 = new gapi.analytics.googleCharts.DataChart({
query: {
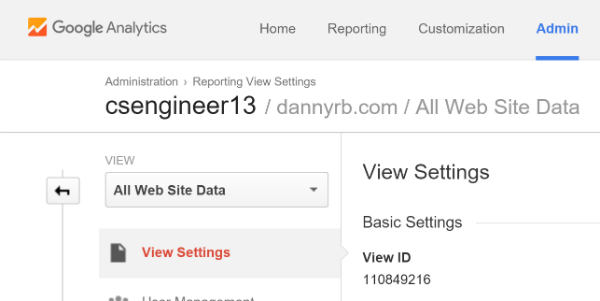
'ids': 'ga:110849216', // THIS NEEDS TO BE A VIEW
'start-date': '30daysAgo', // THAT YOUR SERVICE ACCOUNT HAS
'end-date': 'yesterday', // ACCESS TO
'metrics': 'ga:sessions,ga:users',
'dimensions': 'ga:date'
},
chart: {
'container': 'chart-1-container',
'type': 'LINE',
'options': {
'width': '100%'
}
}
});
dataChart1.execute();
});
</script>
</body>
Note:
- Our
accessTokenis being passed in by the server-side language - Our ViewID
'ids': 'ga:110849216'is specific to our Analytics View
Our Result
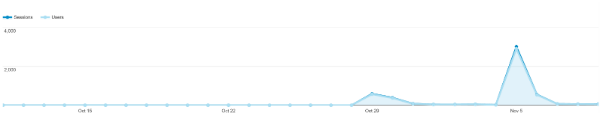
Not beautiful, or even super functional, but it’s a good start!
What Next?
This is a proof of concept, so there are plenty of enhancements that can be made. On the visual UI/UX side we have:
- Set up charts to work for multiple analytic “views”
- Add support for real-time reporting
- Use Chart.js or similar libraries to enhance charts
But there are also performance issues that should be considered. You may want to look into storing common requests into a database, and then using data from your local database to display charts. This has the benefit of using less of your query quota (set by Google), and the page should load much faster coming from a local data source.
Stuck?
If you’re stuck on a step, it could because my guide is now outdated. Try Googling the problem, but don’t be afraid to ask for help in the comments below. I really, really appreciate any advice, feedback, and questions.
Resources
Libraries and Google Documentation
- Determine “Views” you can access
- Google’s PHP API Client
- Embeded API Tutorials
- Crafting different queries to pull back data
My repositories:
Other Blogs/Guides
Most of these use deprecated functions, but they provided a lot of clarity to the process for me. I hope they can help, and if you have specific questions, please feel free to reach out.